Top 10 Best Predictive Analytics and BI tools for Business
Predictive analytics has been getting a lot of press recently. But what exactly is it, and what kinds of business problems is it most useful for?
The key idea behind predictive analytics is to use mathematical modeling to find factors that make one set of data different than another, and then to use those factors to “score” or “predict” other members (people, products, events, etc.) that have the same characteristics of and hence be expected to have the same behavior as the selected target.
Read More: Best Predictive Analytics Software For Small Business
Human beings can look at data in charts/tables and understand a lot of what’s going on. However, the human mind can only work comfortably when looking at 5 or perhaps 10 different factors. Beyond that, untangling relationships becomes extremely difficult. This is where predictive analytics steps in – – powerful algorithms can easily mine across hundreds of factors and quickly highlight those that are most important. A number of leading vendors are today packaging predictive analytics into simple “point and click” interfaces that make it easy for any business analyst or manager to use. That person does not need to know statistics, does not need to select an algorithm, and does not need to build a model that all happens behind the scenes in the software.
For example, consider the marketing manager trying to determine who responded positively to a recent promotion: Not only do they need to know who responded, but other questions such as “what makes the people who responded different from everybody else?” or “Who else fits the same profile?” are key to figuring out what to do next.
Read More: Best Business Intelligence Software For Small Business
Marketing data usually contains a variety of useful factors. For example; demographics, a variety of purchase patterns, and a number of different “opt-in’s”, such as; positive response to previous promotions, information requested from the website, participation in events and seminars, etc. With modern data discovery and analysis tools the marketing manager can simply click on a chart on a dashboard page to select the target group who responded positively to the recent promotion. Using a simple point-and-click interface, a predictive model is run which compares the target group to everybody else who received that promotion. The model highlights the factors that are most unique to the target group, so the marketing manager now has a description of that segment of his prospects. Next, the model is run against the entire prospect list which creates a ranked scoring and also a “high-probability” and “ low-probability” group of those prospects who have not yet responded positively to that promotion but would be expected to do so. This becomes a prime target list for follow-up.
Read More: Top 10 Free And Open Source Predictive Analytics Software
This is the reason why predictive analytics has become so popular. With today’s modern data discovery and analysis tools, every-day business managers can now understand, score, and predict behavior across large and complex data sets without relying on outside experts such as IT or statistics people to prepare or produce results. Better decisions are made in a faster, more efficient, and more fact-based manner.
Predictive Analytics – Classification and Forecasting Models
The idea behind predictive analytics tools is to use mathematical algorithms to find patterns and trends in data. From those patterns and trends, information is gleaned that helps business managers understand causal factors that are driving behaviors in their business. In addition, the models created by predictive analytics tools can be used to “score” or “predict” a set of data to determine others that might fit into the same behavior pattern in the future.
So the basic concept is, a business user selects one of two things:
1. A target he or she wants to compare to the rest of the population.
2. A numeric field he or she wants to forecast.
Lets take a look at each of these two cases:
A good example of assessing a target population would be to look at human resources data around corporate pay. For example, imagine displaying that data on a scatterplot where the horizontal axis is performance (from low on the left to high on the right) and the vertical axis is pay (from low on the bottom to high on the top). One would expect to find an increasing line from the lower left to the upper right – – (e.g., those employees with higher performance should be paid more, while those with lower performance should be paid less.) Invariably, however, there will be outliers such as the top left quadrant which are high paid employees with low performance ratings. That could be a target. So to run predictive tools, the user could select the top left quadrant of high paid/low performers, and then use a simple point-and-click interface to run a regression-based model that will compare that target to the entire population of all employees. The output would be a model describing which factors most explain the outlying behavior of the target. That model could then be used to score or rank the rest of the population to identify employees who are “at risk” to potentially have the same behavior in the future. This type of model is called a “classification model”.
For a forecasting model let’s think about the same example, only in this case, let’s look more generally. (not just at an outlying population of people with high pay relative to low performance) Let’s forecast compensation. Clearly, compensation is a composite that is driven by a number of factors including; job description, location, functional department, training, seniority, etc, etc. Running detailed HR data through a regression forecasting model would use all of these factors to try to determine a formula for compensation. Predictive analytics tools would use the existing compensation levels and compare them to all of these other factors to create a fairly complex multivariable equation. Then, this model can be used to forecast compensation. In that mode it would run all the factors for each of the employees in the equation and calculate an expected compensation for each employee. This model output could then be examined by subtracting the actual compensation from the forecasted compensation, creating a variance.
Using interactive visualization charts, this variance could be displayed in a bar chart where the horizontal axis is all of the employees (perhaps a few hundred thousand) and the vertical axis is the variance. On the left would be a number of bars above the line which would be high-forecasted relative to actual and the right would be bars below the line which are high actual relative to forecast. With interactive visualization a business person could grab different groups off of this visual display then analyze them for make-up across the various other factors in the database.
So, predictive analytics tools have become widespread across the business community as an effective way to better understand underlying business data. Some of these tools are complex and require rich mathematical or statistical background, while others are quite intuitive and, as in examples above, can be used by every-day business people without help from outside experts. This rapidly-growing technology is facilitating business people everywhere to make better and faster fact-based decisions, hence improving overall business performance.
Top 10 Best Predictive Analytics and BI tools for Business:
ALTERYX
Alteryx offers an end-to-end self service data analytics software that empowers data analysts and scientists alike. Alteryx can perform various statistical functions while boasting a user friendly interface, and empowers users to unlock greater insights in hours, not weeks. Learn about Alteryx here!

ALTERYX
IBM
IBM Predictive Analytics employs advanced analytics capabilities spanning ad-hoc statistical analysis, predictive modeling, data mining, text analytics, optimization, real-time scoring and machine learning.
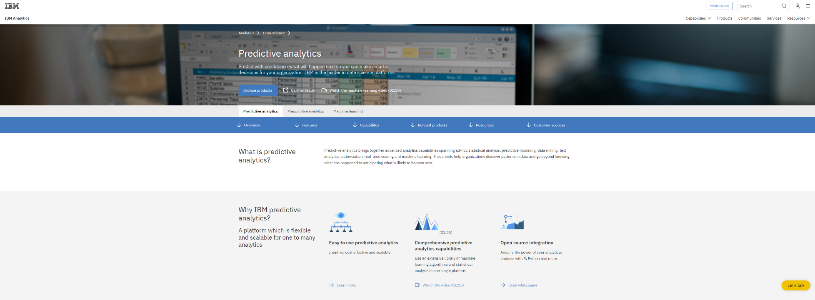
IBM
SAP
Get software and technology solutions from SAP, the leader in business applications. Run simple with the best in cloud, analytics, mobile and IT solutions.

SAP
ZENDESK
Customer service software and support ticketing system by Zendesk. Cloud-based help desk solution used by more than 200,000 organizations worldwide. Happy employees lead to happy customers. Zendesk Explore helps companies provide great service through our predictive analytics tools.
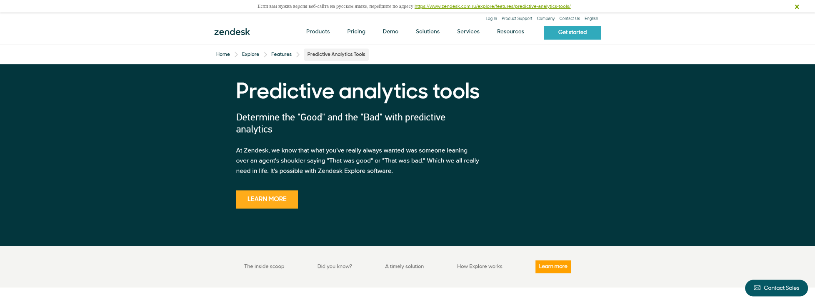
ZENDESK
BOARD
BOARD is an all-in-one CPM and Business Intelligence Software solution that makes it easy to build any business analytics and planning applications. BI and CPM Tools.
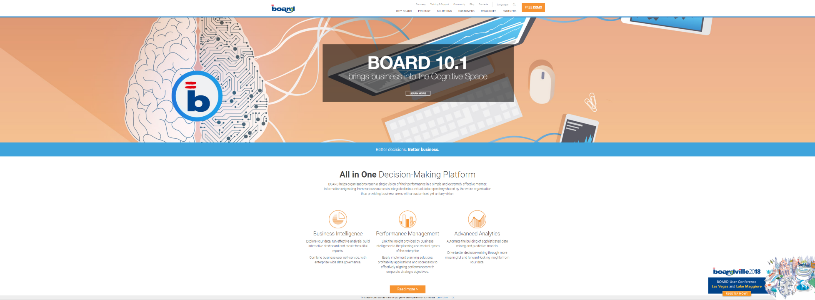
BOARD
ADVIZORSOLUTIONS
ADVIZOR Solutions provides business analysis software & consulting services. Make better, faster decisions from your data with visual, interactive software!

ADVIZORSOLUTIONS
FICO
As a leader in predictive analytics for more than 50 years, FICO has developed new techniques and applied them to a wide range of business problems.

FICO
GREENROPE
The world’s first and only Complete CRM providing powerful and easy to use marketing automation, email marketing, and social media integration. Inquire today with us! Analyze data and make intelligent marketing decisions with predictive analytics software tools offered by GreenRope. Understand your current data to make predictions on the future!

GREENROPE
SALFORD-SYSTEMS
Salford Systems specializes in state-of-the-art machine learning technology designed to assist data scientists in all aspects of predictive model development.
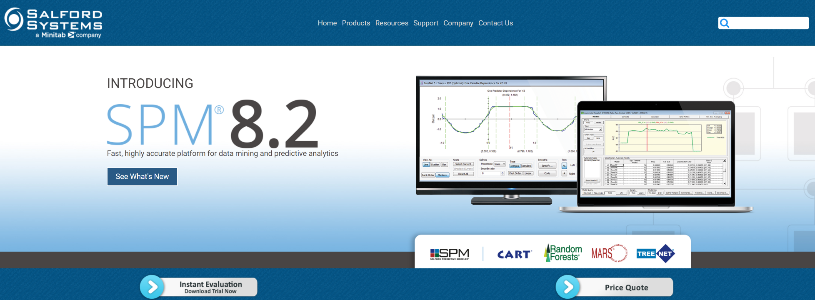
SALFORD-SYSTEMS
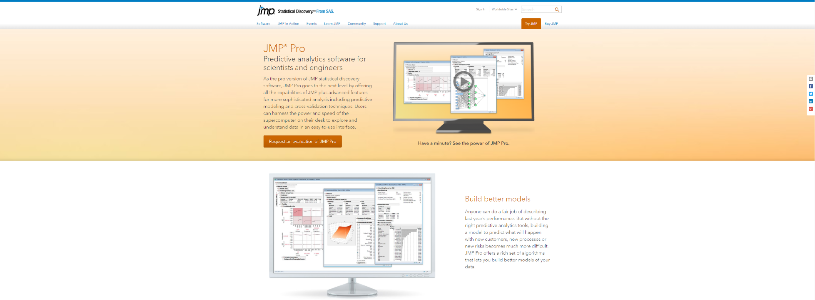
JMP
Statistical software for Mac and Windows. Interactive, visual statistical data analysis from SAS. JMP Pro predictive analytics software provides advanced algorithms for building, assessing and managing predictive models. Request a trial version.
JMP
Personal contact info – slikgepotenuz@gmail.com
Permanent Address :- Montville, NJ
CEO and co-founder at Cloudsmallbusinessservice.com